Chart 1 shows a comparison of selected interest rates as at the end of November 2017. The first striking feature is that the USD yield curve is significantly higher than the other yield curves. The second thing to notice is that the JPY yield curve is considerably flatter (particularly up to 12 years). As a result, USD interest rates are almost 2% higher (at 5 years) than JPY rates. A substantial part of this can be explained by the Fisher equation, which expresses in simple terms the fact that nominal interest rates are equal to the real interest rate plus expected inflation. As expected inflation in the US is around 1.5% above the anticipated rise in prices in Japan, this explains a large part of the difference in interest rates. Another factor to explain this disparity is the difference in term premiums, which are determined based on the money supply (savings) and demand (debt/loans) in each case. For example, a 10-year JPY bond does not cost significantly more than a bond at the short end of the yield curve. This means that there is no significant maturity premium. The fact that the curve is steeper for USD bonds means there is a higher premium for longer maturities.
Yield curves as an investment opportunity
Tuesday, 02/13/2018Since the onset of the financial crisis, the world’s largest central banks have been pursuing an expansive monetary policy on an unprecedented level. This has given a significant boost to the trend of falling interest rates that has persisted since the 1980s and has driven nominal interest rates to record lows, leading global interest rates to differ significantly at times.


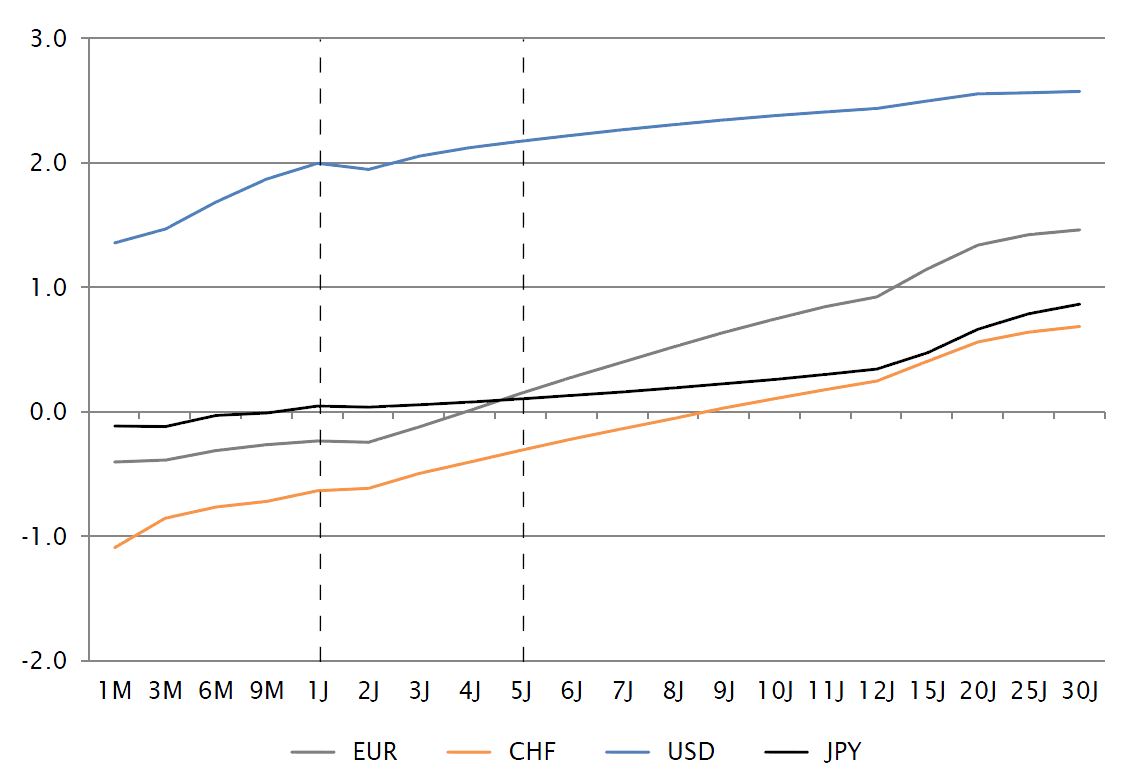
Note : For maturities up to 1 year, the yield curves are based on deposit rates. For maturities over 1 year, the yield curves are based on swap rates. In the case of a swap rate, two parties agree to exchange future interest payments for a specified nominal amount. One party pays a fixed interest rate (equivalent to the interest rates from 1 year in the chart), the other party pays a variable rate that is governed by a reference rate in the interbank market (generally 3 or 6 months) and changes accordingly over the contract period.
For investors, this understandably raises questions about the extent to which such differences in interest rates (without currency risk) represent investment opportunities. The following examples should provide us with an answer as we explicitly avoid including the risk premium for debt that compensates the investor for the default risk.
Let us first assume that a Swiss pension fund (PK) invests for 1 year in a USD bond. In return it receives around 2% interest in USD as can be seen in Chart 1. At maturity the PK gets back the invested amount including interest. We also assume that the PK hedges the foreign exchange risk. It therefore sells the redemption amount including interest in USD forward against CHF. The exchange rate fixed today for 1 year (forward sale) is 95.7 Swiss cents per USD compared to the current exchange rate (spot transaction) of 98.4 Swiss cents per USD. This represents an annual ‘USD devaluation’ of around 2.7%. Expressed in CHF, this equates to a yield of around -0.7%. If the PK had invested directly into a CHF bond, the yield would also be around -0.7% (see Chart 1). This simplified example suggests that an investment in foreign currency bonds hedged against currency risks for the entire term cannot be expected to generate added value and that it therefore does not constitute an investment opportunity compared to investing in CHF bonds.
In practice, currency hedging is generally not undertaken for the entire term but over a horizon of one or several month(s). As a result, currency hedging does not match maturities 100%; there is a risk or opportunity that future (rolling of the expiring) forward sales (based on differences in interest rates) will be concluded with poorer or better conditions. The resulting yield is not known at the outset; instead, it is dependent on the future movements of the yield curves in question (in our example, USD and CHF). This should become evident in the next simplified example.
We assume that our PK again invests in a USD bond; however, this time it invests in one with a maturity of 5 years that yields approximately 2.5% more than a comparable CHF bond (2.2% versus -0.3%, see Chart 1). However, currency hedging is restricted to just one month. The difference in interest rates for one month of around 2.4% (‘currency hedging costs’ p.a.) results in regular added value (‘carry’) of around 0.1% p.a. or approximately 0.5% over the entire term. This scenario applies as long as the yield curves do not change relative to each other. The following two scenarios show what happens if the yield curves do change in this way.
Scenario A: We now assume that the USD yield curve has flattened somewhat a month later so that the 5-year USD bond still yields 2.1% and the interest rate difference to CHF is still 2.4%. Short-term interest rates remain unchanged at -1.1% for CHF and 1.3% for USD. This interest rate movement creates a valuation gain of around 0.5% for the USD bond (we are assuming a 0% bond with a duration of 5 years). There is no change in value from the expiring currency hedge and renewed 1-month hedge respectively. However, the carry has now fallen to 0% as the annual hedging costs are equivalent to the 5-year interest rate difference. If interest rates remain stable for the rest of the term, it would generate the same added value over the entire period as if nothing had happened. If the movement were reversed, this would result in a valuation loss of 0.5%. However, the higher carry (0.2%) would compensate for this loss over the remaining years.
Scenario B: Again we assume that the USD yield curve flattens a month later; however, this time it flattens at the short end, i.e. the USD 1-month rate rises to 1.4%. This movement in interest rates has no impact on bond valuations. However, the expiring currency hedge is renewed at a higher interest rate differential (2.5% p.a.). As in Scenario A, the carry has now fallen to 0%. In contrast to Scenario A, however, the original anticipated additional yield of 0.5% over the term ‘disappears’ if interest rates remain stable for the rest of the term. If the movement were reversed, this would result in a higher carry (0.2%) for the remaining years, which would increase the yield by this amount.
If currency hedging were carried out for the entire term in Scenario A, the valuation gain or loss would be offset by the valuation of the futures contract, as this also depends on the interest rate differentials; however, the carry would be 0% from day one (no investment opportunity compared to CHF bonds). In Scenario B, the change would have no impact on the portfolio as both the bond and futures contract would remain unaffected; however, the carry would also be 0% from day one.
The initial question of whether different yield curves represent an investment opportunity can be clearly answered in the affirmative provided that the investments are not hedged for the entire term. Whether this approach generates a profit or loss compared to CHF bonds depends on the movements of the yield curves relative to each other (CHF yield curve to FRW yield curves).
We can also conclude that foreign currency bonds not hedged for their entire term do not represent ‘genuine’ replacements for CHF bonds (in the sense of a liability match) as they do not share the same reliance on interest rate changes. While the market valuation of CHF bonds and liabilities depend directly on the CHF yield curve, the valuation of hedged foreign currency bonds depends on at least two yield curves.
In summary, we can end this article with the simple conclusion that "there is no such thing as a free lunch".
Disclaimer
This marketing document has been issued by Bank Syz Ltd. It is not intended for distribution to, publication, provision or use by individuals or legal entities that are citizens of or reside in a state, country or jurisdiction in which applicable laws and regulations prohibit its distribution, publication, provision or use. It is not directed to any person or entity to whom it would be illegal to send such marketing material. This document is intended for informational purposes only and should not be construed as an offer, solicitation or recommendation for the subscription, purchase, sale or safekeeping of any security or financial instrument or for the engagement in any other transaction, as the provision of any investment advice or service, or as a contractual document. Nothing in this document constitutes an investment, legal, tax or accounting advice or a representation that any investment or strategy is suitable or appropriate for an investor's particular and individual circumstances, nor does it constitute a personalized investment advice for any investor. This document reflects the information, opinions and comments of Bank Syz Ltd. as of the date of its publication, which are subject to change without notice. The opinions and comments of the authors in this document reflect their current views and may not coincide with those of other Syz Group entities or third parties, which may have reached different conclusions. The market valuations, terms and calculations contained herein are estimates only. The information provided comes from sources deemed reliable, but Bank Syz Ltd. does not guarantee its completeness, accuracy, reliability and actuality. Past performance gives no indication of nor guarantees current or future results. Bank Syz Ltd. accepts no liability for any loss arising from the use of this document. (6)